(not part of the original set of slides)
These slides have been converted into a perhaps-more-readable essay:
colcarroll.github.io/yourplotlib
Feel free to enjoy this version, though!
Building a maintainable plotting library
yourplotlib
yourplotlibColin Carroll
@matplotlib
Slides are online!
colcarroll.github.io/yourplotlib
Code is also available here.
Many thanks to the Matplotlib team and contributors.
Your plotting should understand your domain
- ArviZ
- seaborn & plotnine
- DataFrame.plot (pandas)
- DataArray.plot (xarray)
Style sheets
import matplotlib.pyplot as plt

plt.style.use('default')

Style sheets
plt.style.use('classic')
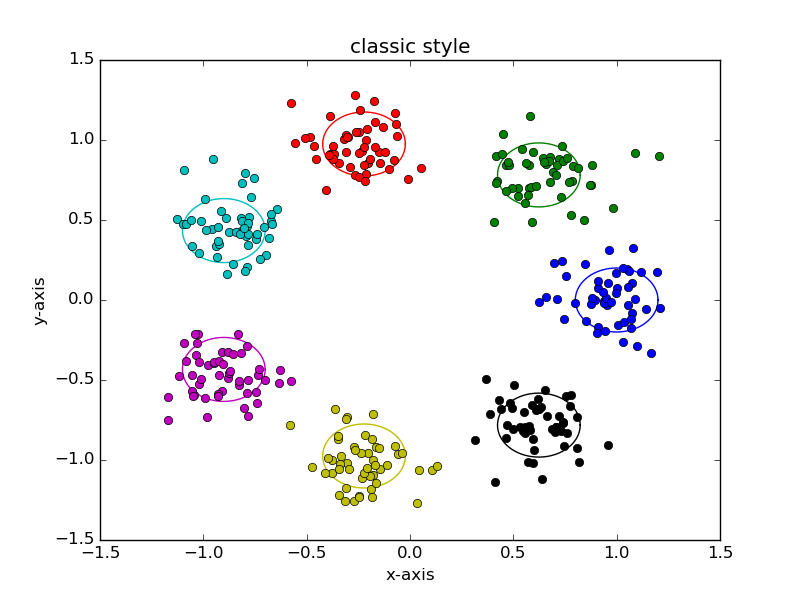
Style sheets
plt.style.use('ggplot')
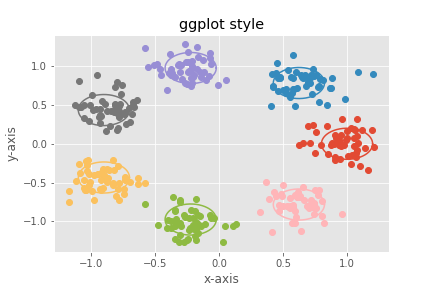
Style sheets
plt.style.use('fivethirtyeight')
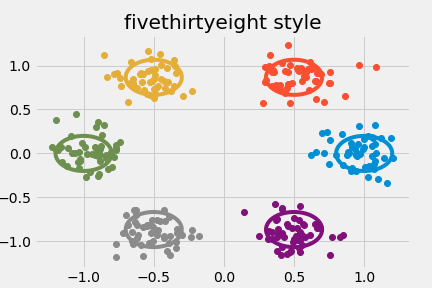
Style sheets
plt.style.use('tufte')
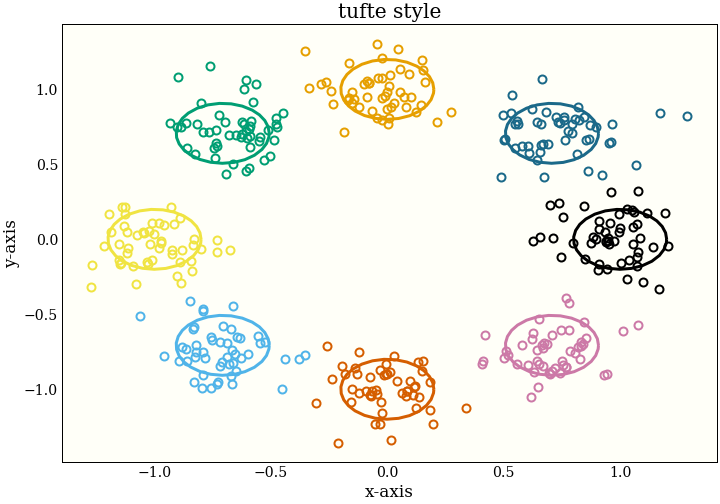
Set a stylish default
import matplotlib.pyplot as plt

plt.plot(*np.random.randn(50, 2))
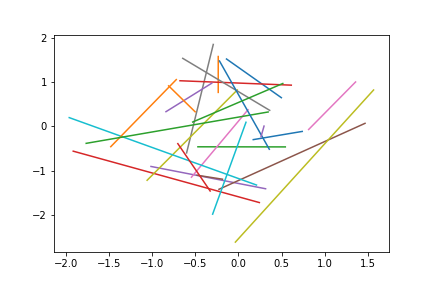
Set a stylish default
plt.rcParams.update({
    "axes.prop_cycle": plt.cycler(
        "color",
        ["#EE9041", "#459DB9", "#667B83"]),
})
plt.plot(*np.random.randn(50, 2))

Set a stylish default
plt.rcParams.update({
    "figure.figsize": [10.0, 3.0],
})
plt.plot(*np.random.randn(50, 2))

Set a stylish default
plt.rcParams.update({
    "lines.marker": "d",
})
plt.plot(*np.random.randn(50, 2))

Set a stylish default
plt.rcParams.update({
    "lines.linestyle": "",
})
plt.plot(*np.random.randn(50, 2))

Set a stylish default
plt.rcParams.update({
    "lines.markersize": 48.0,
})
plt.plot(*np.random.randn(50, 2), clip_on=False)

Set a stylish default
plt.rcParams.update({
    "axes.spines.bottom": False,
    "axes.spines.top": False,
    "axes.spines.left": False,
    "axes.spines.right": False,
    "xtick.major.bottom": False,
    "ytick.major.left": False,
})
plt.plot(*np.random.randn(50, 2), clip_on=False)

Set a stylish default
plt.rcParams.update({
    "lines.markeredgecolor": "black",
})
plt.plot(*np.random.randn(50, 2), clip_on=False)

Set a stylish default
x = np.linspace(-4, 4)
plt.plot(x, np.cos(x), clip_on=False)
plt.plot(x, np.sin(x), clip_on=False)
plt.plot(x, -np.cos(x), clip_on=False)

Save your styles
Print Configuration:
print(plt.rcParams)
Convert output to RcParams format
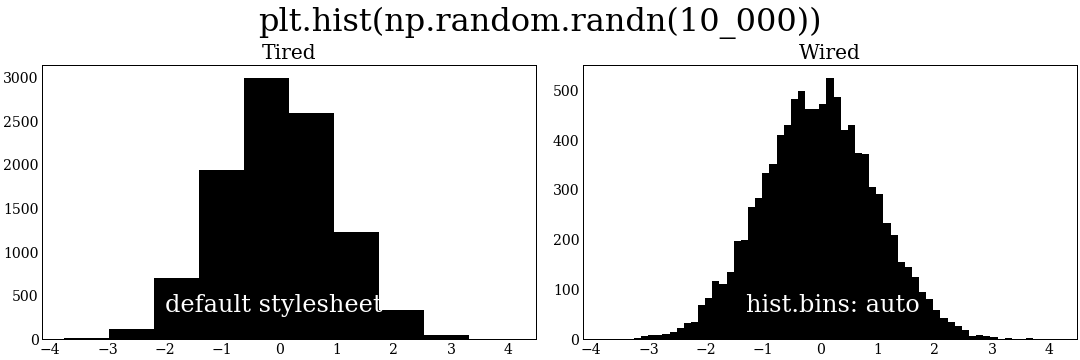
    font.family: serif
    figure.facecolor: #fffff8
    axes.facecolor: #fffff8
    font.size: 14.0
    hist.bins: auto
    lines.markersize: 8.0
Save to "my_style.mplstyle"
from pathlib import Path
print(Path(matplotlib.get_configdir()) / "stylelib")
plt.style.use("my_style") # all set!
...You can also pip install styles if you are careful
Be bold.
Wrap Your Plots
def confetti(N, *, ax=None, **kwargs):
    if ax is None:
        ax = plt.gca()
    my_artists = ax.plot(*np.random.randn(N, 2),
                         clip_on=False, **kwargs)
    return my_artists
def solitare(x, *, ax=None, **kwargs):
    if ax is None:
        ax = plt.gca()
    kwargs.setdefault('clip_on', False)
    my_artists = ax.plot(x, np.cos(x),
                         x, np.sin(x),
                         x, -np.cos(x),
                         **kwargs)
    return my_artists
Use Your New Plotting Methods
_ = confetti(42)

Customize Your Plots
        _ = confetti(20, marker='*', markersize=50)
        _ = confetti(87, markersize=10)

Compose Your Plots
    fig, (ax1,ax2) = plt.subplots(nrows=2)
    _ = solitare(np.linspace(-np.pi, np.pi), ax=ax1,
                    markersize=30, marker='$\infty$')
    _ = confetti(13, ax=ax2, marker='>')

Build custom plots with Artists


fig, ax = plt.subplots()
lc = LineCollection(
    segments=[
        ((0, 1), (1, 1), (2, 1), (3, 1)), # flat line
        ((0, 1), (1, 2), (2, 3), (3, 4)), # straight line
        ((0, 0), (1, 2), (2, 4), (3, 9)), # parabola
    ],
)
ax.add_collection(lc)
ax.set_ylim(0, 9)
ax.set_xlim(0, 3)

...
lc = LineCollection(
    segments=...,
    colors=('red', 'green', 'blue'),
    linewidths=(4, 8, 12),
    linestyles=('dashed', 'dotted', 'solid')

)
...

...
lc = LineCollection(
    segments=[
        ((0, 0), (1, 2)),
        ((1, 2), (2, 4)),
        ((2, 4), (3, 9))
    ], ...
)
...

Working with LineCollection
x = np.linspace(-2, 2)
y = x ** 2

points = np.vstack((x, y)).T
# array([[-2.        ,  4.        ],
#       [-1.91836735,  3.68013328],
#       [-1.83673469,  3.37359434],
#       [-1.75510204,  3.08038317],...
segments = list(zip(points[:-1], points[1:]))
fig, ax = plt.subplots()

lc = LineCollection(segments=segments)

ax.add_collection(lc)
ax.set_ylim(-0.2, 4)
ax.set_xlim(-2, 2)

linewidths = 30 * np.abs(np.sin(10 * x))
...

lc = LineCollection(
    segments=segments,
    linewidths=linewidths
)
...

cmap = plt.get_cmap('viridis')
...

lc = LineCollection(
    segments=segments,
    linewidths=linewidths,
    colors=cmap(np.abs(np.sin(5 * x))),
)
...

Light wrappers for your use
def plot_line(x, y, linewidths=None, colors=None, ax=None):
    points = np.vstack((x, y)).T
    segments = list(zip(points[:-1], points[1:]))
    if ax is None:
        ax = plt.gca()

    lc = LineCollection(
        segments=segments,
        linewidths=linewidths,
        colors=colors,
    )
    ax.add_collection(lc)
    #  ...mess with scales...
    return lc
x = np.linspace(-2, 2)
y = x ** 2
linewidths = 30 * np.abs(np.sin(10 * x))
colors = plt.get_cmap('viridis')(np.abs(np.sin(5 * x)))

# Our custom function!
plot_line(x, y,
          linewidths=linewidths,
          colors=colors)

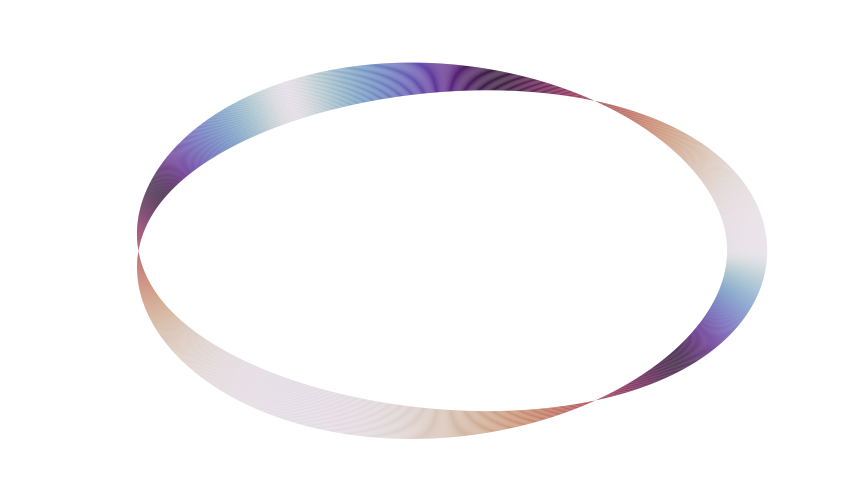
t = np.linspace(0, np.pi * 2.0, 2_000)
cmap = plt.get_cmap('rainbow')
colors = cmap(np.abs(np.cos(t * 1.25)))

plot_line(np.cos(t), np.sin(t), # circle
          linewidths=40 * np.cos(1.5 * t), # 3 turns
          colors=colors)
ax.axis('off')
Share Your Library
Package like any standard Python package 🙃
We love to help:
discourse.matplotlib.org/c/development/3rdpartyMatplotlib is a Library & an Application
This is a source of... tension
A library wants to help you build tools
An application wants to help you do something
A library should be explicit
An application should "do the right thing"...
...but "the right thing" is very subjective
Build the interface you need
- Write wrappers around Axes methods
- Write your own functions that instantiate Artists
- Write your own Artist classes that reimplement draw
Talk to us!
discourse.matplotlib.org